Netflix Tableau Dashboard
Netflix Content Analysis Dashboard
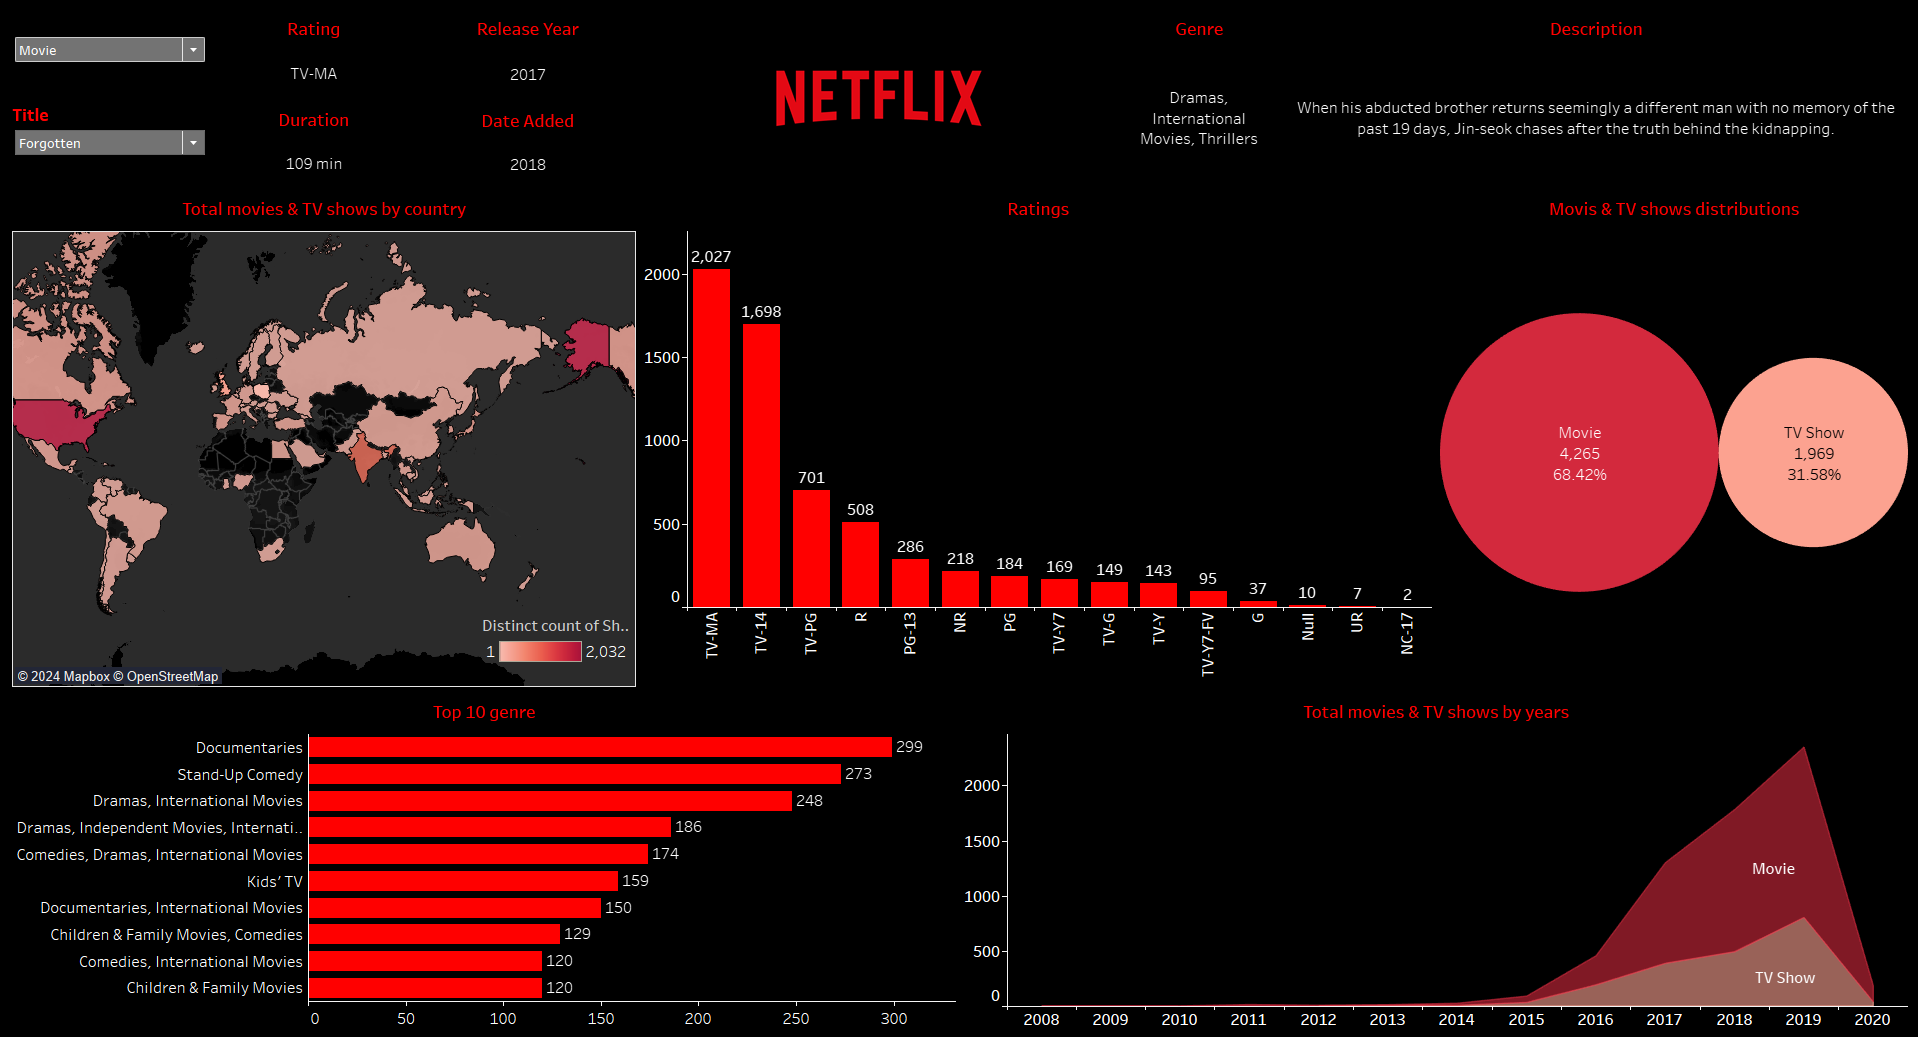
Overview
This dashboard provides an in-depth analysis of Netflix's content library, focusing on various attributes such as ratings, genres, release years, and geographic distribution. The visualizations offer insights into the types and distributions of movies and TV shows available on Netflix.
Visualizations and Insights
- Total Movies & TV Shows by Country:
Description: A world map showing the count of distinct Netflix titles available in each country.
Insight: The United States has the highest number of titles, followed by countries with significant content production and consumption such as India and the United Kingdom. - Ratings Distribution:
Description: A bar chart displaying the distribution of Netflix titles across different rating categories.
Insight: The majority of titles are rated TV-MA, followed by TV-14 and TV-PG. This indicates a significant amount of content suitable for mature audiences. - Top 10 Genres:
Description: A horizontal bar chart listing the top 10 genres by the number of titles.
Insight: Documentaries and Stand-Up Comedy are the most popular genres, followed by Dramas and International Movies. This highlights the diverse range of content that appeals to various audience preferences. - Movies & TV Shows Distributions:
Description: A bubble chart showing the distribution of movies and TV shows.
Insight: Movies constitute 68.42% of the total content, with TV shows making up 31.58%. This indicates a larger library of movies compared to TV shows on Netflix. - Total Movies & TV Shows by Years:
Description: An area chart illustrating the total number of movies and TV shows added to Netflix over the years.
Insight: There has been a significant increase in the number of titles added, particularly from 2015 onwards, reflecting Netflix's aggressive content expansion strategy. - Detailed Content Information:
Description: This section provides detailed information about a specific title, including rating, release year, duration, date added, genre, and description.
Insight: For example, the selected title "Forgotten" is a 2017 TV-MA rated movie with a duration of 109 minutes, added to Netflix in 2018. It belongs to the genres of Dramas, International Movies, and Thrillers.
Data Source
The data for this dashboard is sourced from Netflix's content library, encompassing information on ratings, genres, release years, geographic availability, and other relevant attributes of movies and TV shows.
Tools and Technologies
Data Analysis and Visualization: The dashboard was created using data visualization tools such as Tableau or Power BI.
Design: The visualizations are designed to provide a clear and comprehensive overview of Netflix's content distribution, helping users understand the breadth and depth of the available titles.
Conclusion
This dashboard provides valuable insights into the variety and distribution of content on Netflix. It highlights the predominant genres, ratings, and the geographical spread of titles, as well as trends in content additions over the years. Such insights can be useful for content analysts, marketing strategists, and viewers looking to explore Netflix's extensive library.
Portfolio Application
This dashboard is part of my professional portfolio, showcasing my skills in data analysis, visualization, and storytelling. It demonstrates my ability to work with large datasets, derive meaningful insights, and present them in an engaging and informative manner.