Spotify Tableau Dashboard
Spotify Top Tracks 2023 Dashboard
Overview
This dashboard presents a comprehensive analysis of Spotify's top tracks for the year 2023. It includes various visualizations to depict key musical attributes, trends, and popular tracks based on the data available.
Visualizations and Insights
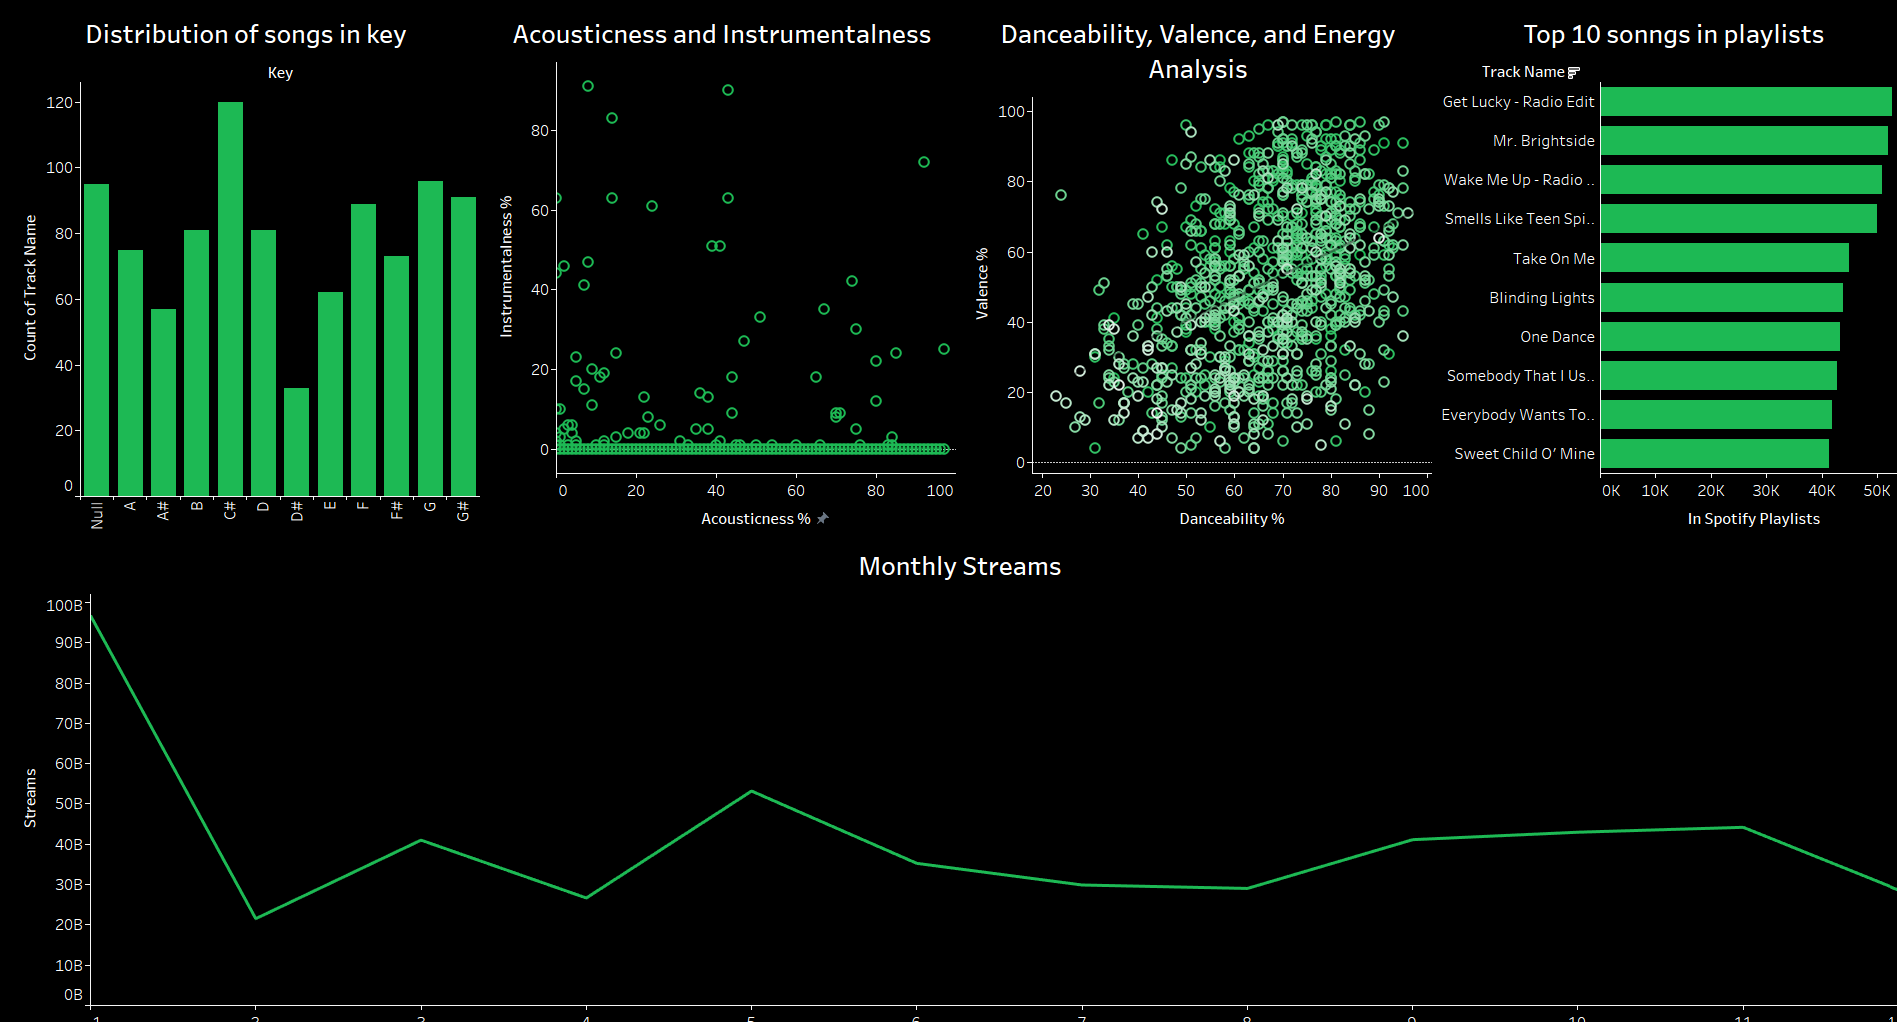
- Distribution of Songs in Key:
Description: This bar chart shows the distribution of songs across different musical keys.
Insight: The most common key for the top tracks is B, followed by C and A. There is a noticeable drop in the number of songs in the key of E. - Acousticness and Instrumentalness:
Description: A scatter plot displaying the relationship between the acousticness and instrumentalness of the tracks.
Insight: Most tracks have low acousticness and low instrumentalness, indicating a trend towards more electronic and vocal-centric music. - Danceability, Valence, and Energy Analysis:
Description: This scatter plot explores the relationship between danceability, valence (musical positivity), and energy of the tracks.
Insight: There is a diverse spread in danceability and valence, with a clustering of tracks in the higher danceability range. High-energy tracks tend to also have higher danceability and valence. - Top 10 Songs in Playlists:
Description: A horizontal bar chart listing the top 10 songs included in Spotify playlists.
Insight: "Get Lucky - Radio Edit" by Daft Punk is the most featured song in playlists, followed closely by "Mr. Brightside" by The Killers and "Wake Me Up - Radio Edit" by Avicii. - Monthly Streams:
Description: A line graph showing the number of streams per month.
Insight: There is a peak in streams at the beginning of the year, followed by a decline and subsequent fluctuations throughout the year.
Data Source
The data used for this dashboard was obtained from Spotify's top tracks of 2023. This dataset includes various attributes of the tracks such as key, acousticness, instrumentalness, danceability, valence, energy, and monthly streams.
Tools and Technologies
Data Analysis and Visualization: The dashboard was created using Python with libraries such as Pandas, Matplotlib, and Seaborn.
Design: The visualizations are designed to be intuitive and informative, providing clear insights into the music trends and characteristics of the top tracks of 2023.
Conclusion
This dashboard provides valuable insights into the musical trends of 2023's top tracks on Spotify. It highlights the prevalent musical keys, the characteristics of popular tracks, and trends in their streaming performance over the year. This tool can be beneficial for music analysts, producers, and enthusiasts looking to understand contemporary music trends.
Portfolio Application
This dashboard is part of my data analysis and visualization portfolio, demonstrating my ability to analyze large datasets and present meaningful insights through visualizations. It showcases my proficiency in using Python for data manipulation and creating visually appealing and informative dashboards.